Background
How did fusion-tools start?
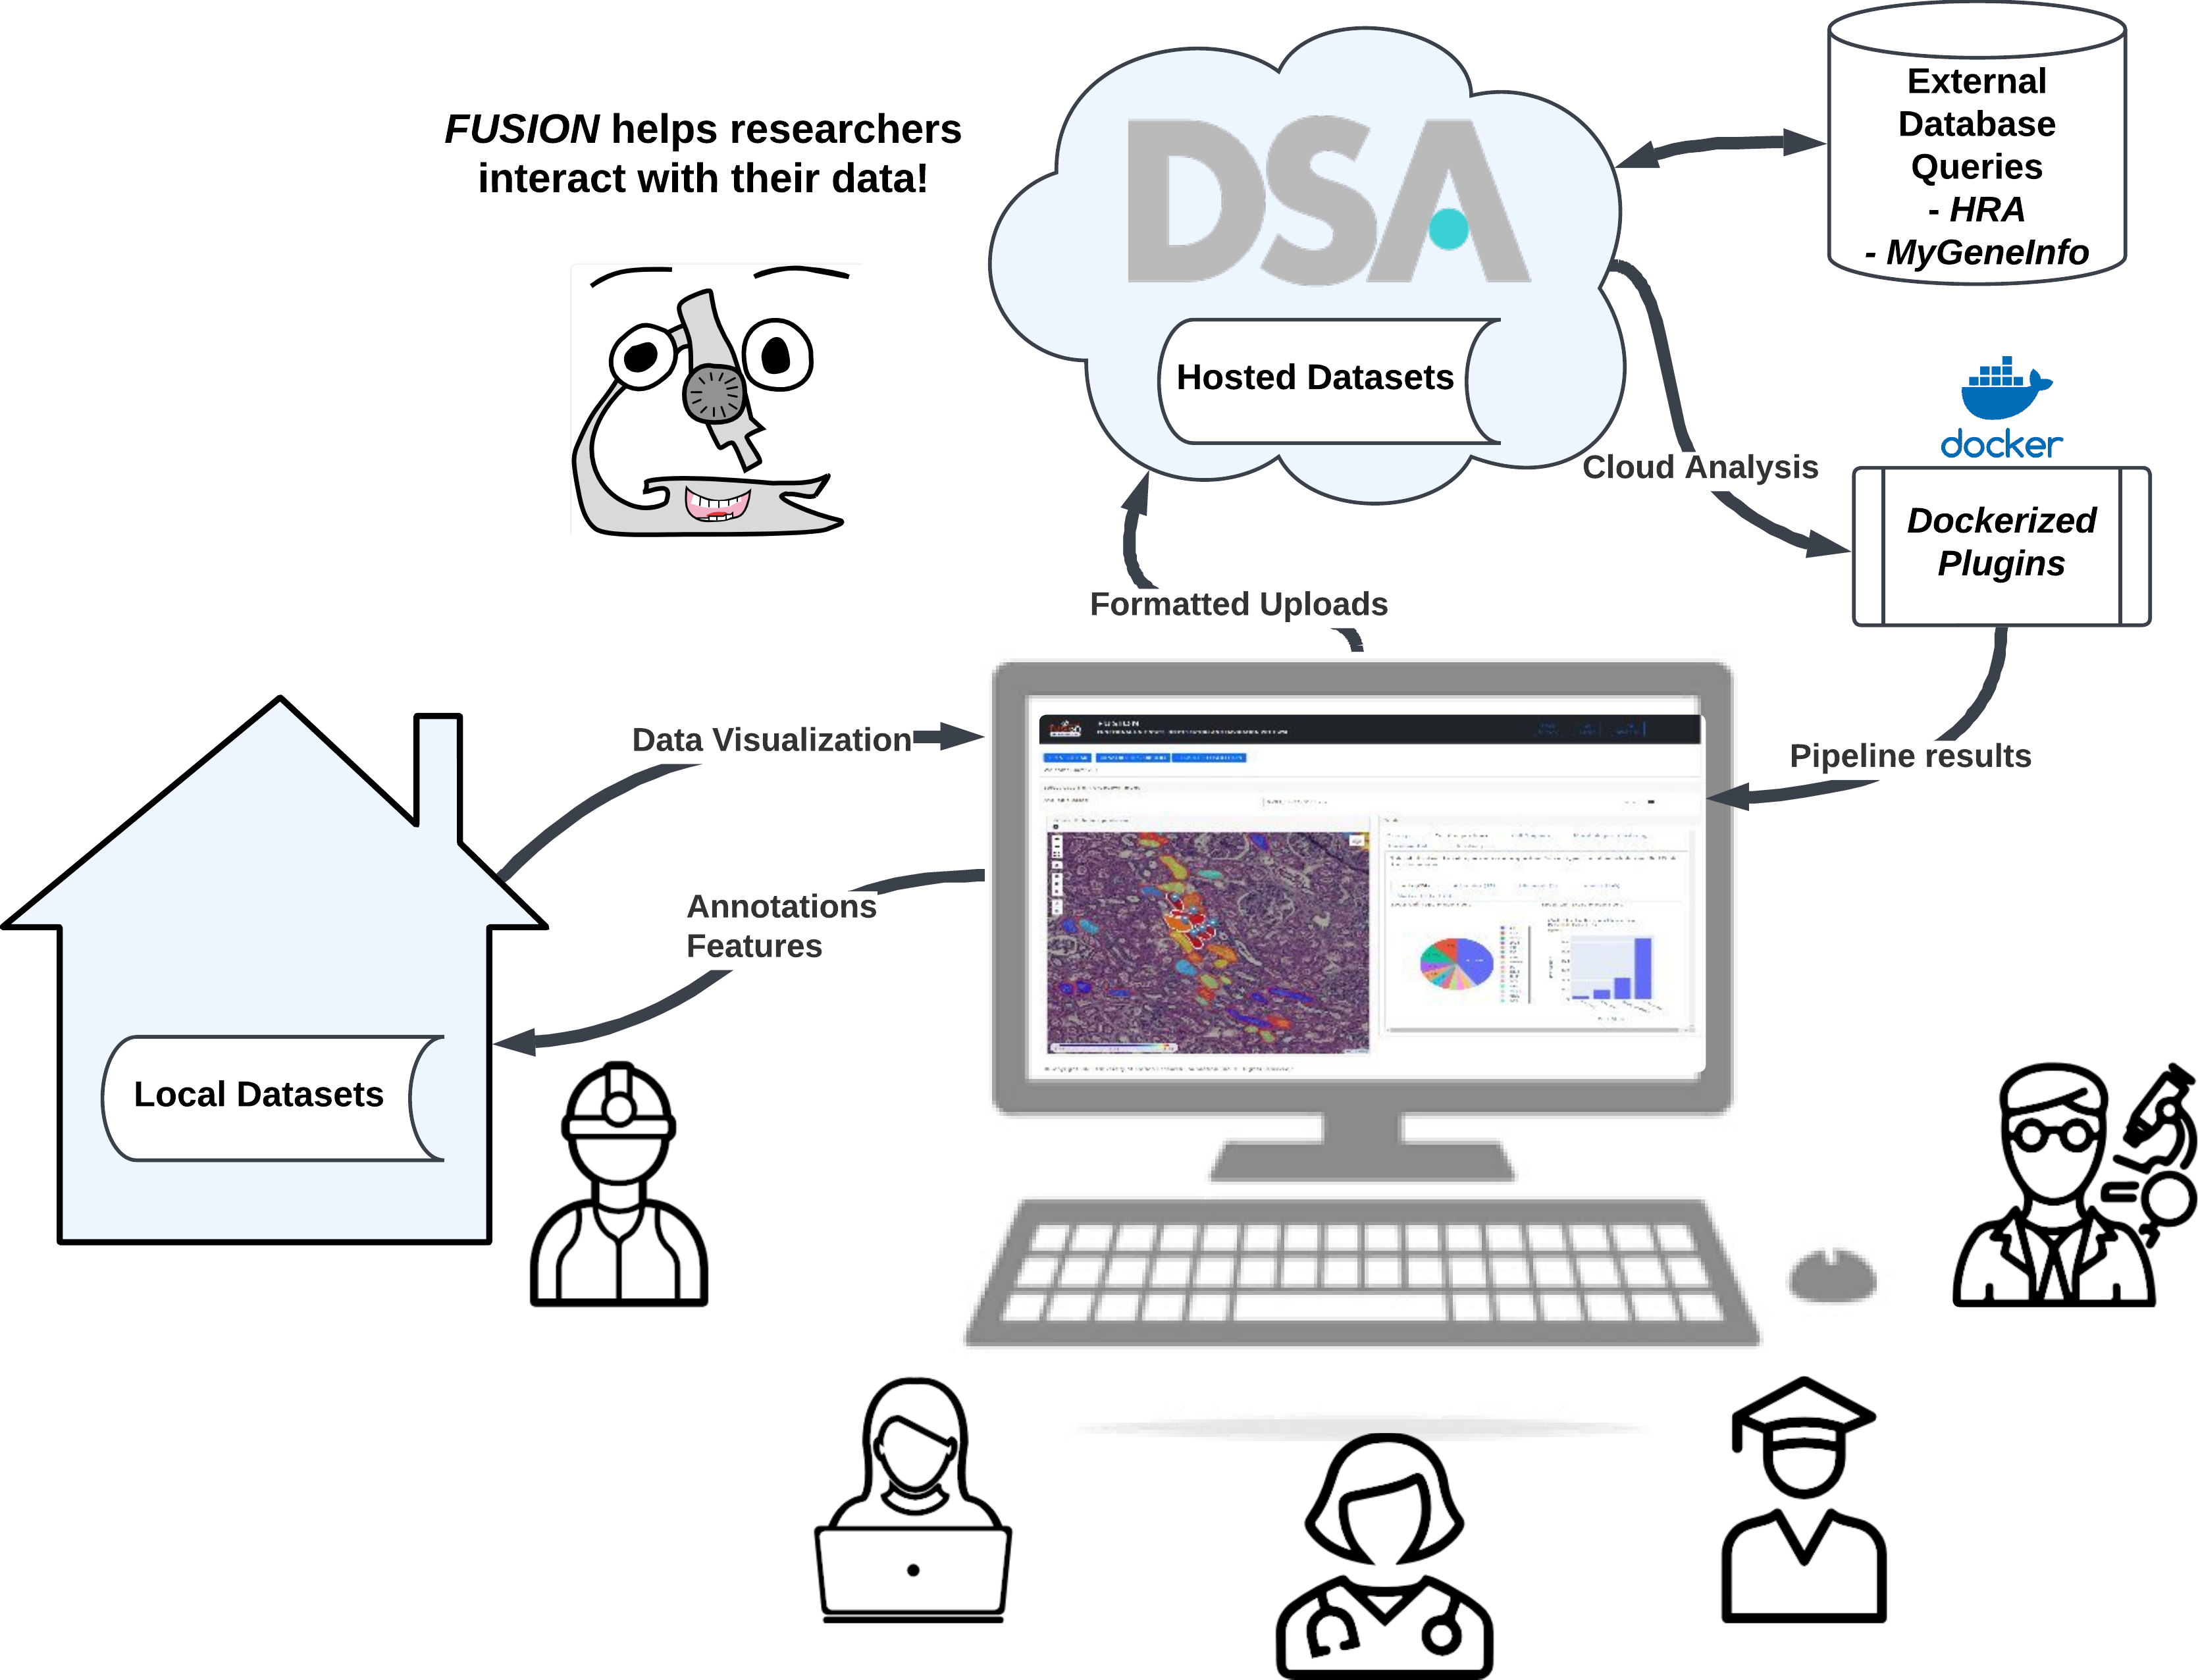
fusion-tools was designed in collaboration with pathologists and cell biologists to streamline communication and facilitate interactive analysis on whole slide images (WSIs).
One of the main guiding principles behind fusion-tools is that annotated or segmented structures contain valuable data and by putting those data units (functional tissue units if you work with HuBMAP) in a spatial context, the result is greater than the sum of its parts. The addition of spatial or relative positional information allows us as researchers to obtain a greater understanding of whether a particular signal that is observed is diffuse or localized. While this is not new by any means in the field of pathology, utilizing computational image analysis and other techniques can enable this information to be quantitatively captured and used to provide a basis for comparison across many individual samples.
What makes fusion-tools different from __________?
Many similar tools are emerging these days which also facilitate visualization of WSI and overlaid annotations. Of course, whichever tool you are already most familiar with you will probably find easier to use than any new tool. However, there are several functionalities which we would argue are easier to accomplish in fusion-tools than in other tools.
These include:
1. Multiple levels of interactive analysis and annotation
More than just generating one type of plot, fusion-tools includes the ability to dynamically select individual or multiple structural properties as well as filters to generate plots which “link” back to the original images from which each data point is derived. This makes it much easier to discern whether or not a given quantitative measure is capturing “real” data or if it is just noise.
2. Interoperability for many different types of images
fusion-tools' main image reader is large-image which covers a vast array of tile sources (OpenSlide, DeepZoom, DICOM, OME-TIFF, ZARR, GDAL, etc.).
3. Several types of input annotation formats allowed
By default, fusion-tools works with GeoJSON formatted annotations. However, read functions are included for Aperio ImageScope (.xml), large-image annotations (HistomicsUI) (.json), as well as a few special formats. In general, GeoJSON formatted annotations are the easiest to work with, and enable direct embedding of key structural identification properties.
4. Extensability
Using Dash as the main framework enables users to embed custom components in the form of DashBlueprint objects with interactive callbacks that can extend across built-in components. Furthermore, developers more familiar with JavaScript can take advantage of clientside_callbacks in custom components or they can even convert React components into Dash components.
Where should I start?
Start by taking a look at the documentation for the Visualization class and go over how to create custom layouts with multiple components and pre-loading your session with locally stored data. Then go over the interactive properties of each Component to see if your use case is already covered. If it isn’t, read through the examples for designing *CustomComponent*s or submit a PR with a feature request and we’d be happy to help!
Happy Fusing!